Your Success Rate is Lying to You: Real Payment KPIs You Should Track
- PayConsults
- Aug 8, 2025
- 6 min read

Merchants often interpret that a high success rate is a sign of good payment health. But this is just a misinterpretation.
Based on our experiences working with multiple merchants coming from adult entertainment, iGaming, Forex, Adult AI chatbot sites, here are the key KPIs for good payment processing
Many providers brag about the 70% success rate, but that’s half the truth. It is easy to track success rate but dangerously misleading. Relying solely on success rate can expose your business to fraud and decline risks because you are not digging deeply.
Success Rate and its Limitations
Basic formula: Success rate = Successful Transactions / Number of attempted transactions
Why misleading?
Doesn’t account for
fraudulent approvals
Soft declines due to BIN block, country mismatch, velocity block
Recoverable declines
Often doesn’t segment by issuer, BIN, Country, Amount, Card type
70% Success rate looks good until you realize that 20% are blocked due to your own fraud settings
Secondly, the Cost of ignoring failed transactions
Never diving deep into the failed transactions is like nerve asking the customers why walking out of the store.
Failure Categories:
Do Not Honor (05)
Issuer declines
Fraud related declines
Gateway declines
3Ds Declines
Track:
Recovery Potential - What % of decline are retried successfully
Reasons for failures or declines
Key Performance Indicators (KPIs) for Good Payment Processing
KPI 1 - Authorization Rate vs Success Rate
Auth. Rate = Authorized transaction / Total attempted transactions
Auth Rate ≄Success rate
Every authorized transaction would be successfully captured is not guaranteed.
It is best to compare both Auth Rate and Success Rate together to find out the post Authorization errors or issues.
KPI 2 - Conversion rate by Country, BIN, and Device
BIN is a bank Identification Number. It is the first 6-8 digits of the card. These 6-8 digits tells you:
Issuing Bank
Card Type (Credit, Debit, Prepaid…)
Card Brand (Visa, MasterCard, Amex...)
Country of Issuance
BIN with high decline ratios could be because of
Geo Blocks - Some BINs are flagged or marked as risky by acquirers
Card Brand mismatch - Your provider only allows you to accept Visa and MC, but the user card is of Amex or Discover.
Cards like Prepaid card Virtual Credit Cards, often have low success rate
Use case scenario - We observed UK cards received 50% Success rate whereas US cards are at 85% Success rate.
We used the BIN logic and found that UK cards were routed to a US acquirer due to which the success rate was low.
To solve this, we simply route the UK cards to a UK based acquirer, which ultimately gives 75% success rate.
Device also adds value to payments conversion. IOS vs Android, Mobile vs Desktop. Conversion by device often matters for merchants like Adult, AI Chatbot, Gaming.
Your fraud rules or UI might behave differently on mobile vs desktop.
Some mobile browsers block certain JS calls (affecting embedded forms).
High-risk gateways may treat mobile transactions as riskier by default.
Use case - On analysis, we discovered that iOS Safari users receive 20% more 3DS failures due to popup blockers. You can optimize by switching to frictionless 3DS or hosted checkout for iOS devices
How to calculate?
Conversion Rate by Device = Successful transactions from that Device ÷ Total transaction attempts from that Device × 100
Country - Success rate by Country differs as well
Local regulations
Card brand limitations (E.g. Amex is weak in Asia)
Local Fraud filters
E.g., Brazil was receiving only 50% success rate because the current payment gateway didn’t have the local payment option or support local card option
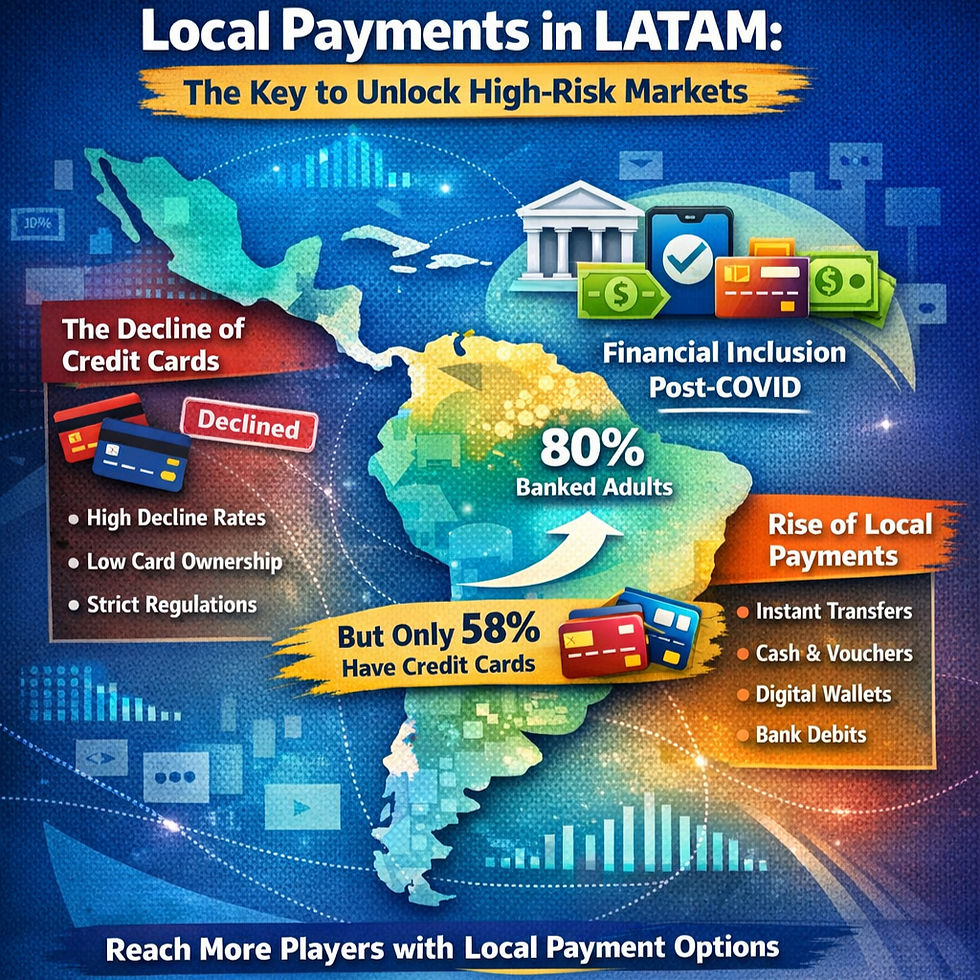
Localization in payments is an underused tool. Focus on localization to grow in regions like Latin America, Asia because local payment is king.
KPI 3 - Retry Success Rate
Retry success rate measures how many previously failed transactions succeeded after retrying.
The basic formula is
Retry success rate = (Number of successful retries / total attempted retries) *100
In businesses like adult entertainment, AI Chatbot or iGaming, declines happen a lot. And often it is soft declines like 05 Do Not Honor or due to fraud rules that can prevent legitimate transactions.
Such declines can be recovered with retires
A different gateway
Different time (e.g., 5 minutes later)
Adjusted fraud rules or 3DS method
Let's consider If out of 1000 transactions 600 got successfully converted. And 400 never been retried you lose 400 potential customers.
But if retried after sometime or bending fraud rules. You retry 200 of the 400 failed
70 succeed on retry
New total = 670 successes
New effective success rate = 67%
You recovered ~10% more revenue from the same traffic. More cash flow.
KPI 4 - Cost per Transaction
Cost per Transaction (CPT) is an actual cost incurred to a merchant for each transaction including all direct and hidden fees.
Let’s say over a week, you have:
10,000 attempted transactions
6,000 successful
Total cost breakdown:
Gateway: $0.25 × 10,000 = $2,500
MDR (avg 5%): $15,000
Fraud tool: $0.10 × 10,000 = $1,000
Chargeback/dispute cost: $600
FX losses & cross-border fees: $1,200
Total = $20,300
Now, CPT formula is
CPT = Total cost of payment processing a period / Number of successful transactions
CPT = $20,300 / 6,000 = $3.38 per successful transaction
If your ticket size is $15 — you’re spending over 22% of your revenue on just processing!
KPI 5 - Fraud to Success Ratio
It is not only about fraud before a transaction succeeds. There are transactions that are flagged fraud after it is successfully settled.
What % of your successful transactions are later flagged as fraud?
A clean looking successful transaction sometimes ruins the good payment system.
Ruin your chargeback ratio
Get you flagged or terminated by your acquirer
Lead to scheme blacklists (Visa/Mastercard)
Cause rolling reserves to increase or settlements to be delayed
Attract brand reputation damage and bad press
The best case scenario is friendly fraud. This user never claims that the transaction was authorized by them.
Fraud-to-Success Ratio = (Fraudulent Successful Transactions ÷ Total Successful Transactions) × 100
A high F-S ratio tells that you are approving lots of risky transactions. It’s time to revamp the fraud rules.
KPI 6 - Chargeback Rate per PSP or Route
Most merchants only look at their overall chargeback rate, but in reality:
Some PSPs may be more lenient but attract risky users.
Some acquirers may be slower to react to fraud, leading to delayed chargebacks.
Some routing paths (e.g., 3DS vs non-3DS, BIN-based) may yield more disputes.
Chargeback Rate per PSP =
(Chargebacks from PSP X / Successful Transactions via PSP X) × 100
Even if a PSP offers high success rate but the chargeback rate is still high, then there are high chances that you will be flagged
You may need to be enrolled in programs like VAMP from Visa for monitoring
Your account maybe flagged or shunned
PSP | Success Rate | Chargeback Rate |
A | 70% | 2.5% (Risk Zone) |
B | 60% | 0.4% (Safe) |
C | 85% | 3.0% (Critical) |
KPI 7 - Refund Rate vs Rebill Rate
How many users ask for refunds after purchasing
How many users successfully go through with rebilling (especially in subscriptions)
It's a powerful way to measure user satisfaction, product-market fit, and fraud patterns.
High Refund rate means bad user experience or deceptive service
Low Rebill rate means low lifetime value, bad user experience or card expired
Rebill Success but high refund - Could be high friendly fraud
This is very common in high-risk space
Adult Site - User take a subscription, use it for a month, watch the videos later after claim that they didn’t authorize the transaction and file for chargeback
Same with iGaming - user join, deposit the money and if lose all the money, they simply claim the refund
How to prevent it?
Clear terms and service
Pre-checkout reminders before taking subscription payment
Following clear terms and conditions
Using clear billing descriptor
The Real KPI Board with PayConsults
We at PayConsults offer customized KPI reports based on your processing history every month. Success rate is just an iceberg tip, we dive deep into your business and payments to find out what is wrong and what could be done to keep your payments in good health.
Don’t settle for surface level metrics. Boost your conversion with PayConsults.
Reach out today.


Comments